To view previous releases, select one from the dropdown box:
Currently displaying information released on: May, 2017
CANADIAN INCOME SURVEY, 2015
Statistics Canada has released further indicators of income for 2015 for Nova Scotia.
INDIVIDUAL INCOME
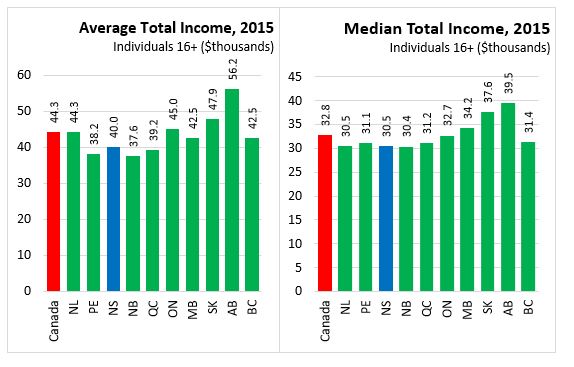
Individual income statistics below are for the population 16 years of age and older and exclude persons with zero income. Dollar estimates are expressed in 2015 constant dollars to factor in inflation and enable comparisons across time in real terms.
In 2015, the average income of Nova Scotians age 16 years and over (excluding those with zero income) was $40,000, about 90 per cent of the Canadian average. Average income figures can be biased by higher earners with very large incomes, so median income offers a different perspective. The median is the level of income at which half the population has higher income and half has lower. In 2015, the median income of individuals in Nova Scotia was $30,500 or 93 per cent of the national median.
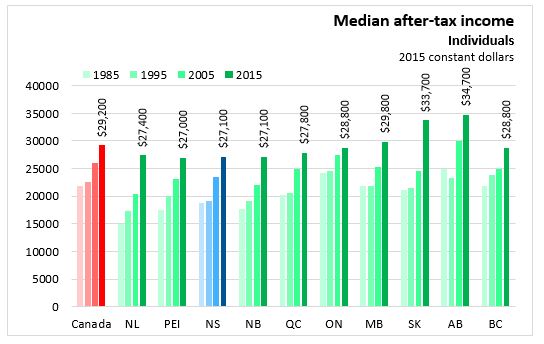
Median individual after-tax income was $27,100 (excluding persons with no income), down $500 (-1.8%) from 2014 (2015 constant dollars). The median after-tax income in Canada was $29,200 (-1.0%), down $300 from 2014.
INCOME OF FAMILIES AND PERSONS NOT IN AN ECONOMIC FAMILY
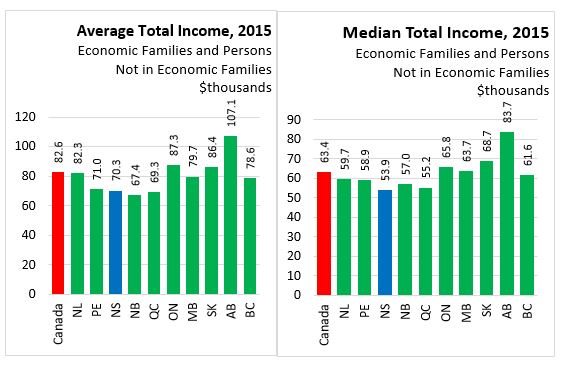
Income estimates below exclude persons under 15 years of age. Dollar estimates are expressed in 2014 constant dollars to factor in inflation and enable comparisons across time in real terms. An economic family refers to a group of two or more persons who live in the same dwelling and are related to each other by blood, marriage, common-law, adoption or a foster relationship.
In 2015, the average total income of all Nova Scotian economic families and persons not in an economic family was was $70,300, about 85 per cent of the Canadian average. Median total income in Nova Scotian economic families and persons not in an economic family was $53,900 or 85 per cent of the national median, the lowest in Canada.
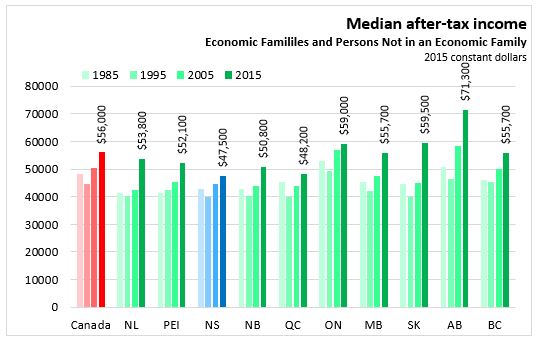
Median after-tax income in Nova Scotian economic families and persons not in an economic family was $47,500, down 2.7 per cent from 2014 (2015 constant dollars). The median after-tax income in Canada was $56,000, down 0.4 per cent from 2014.
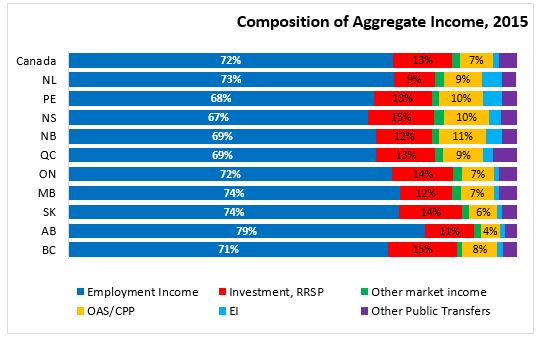
COMPOSTION OF INCOME
The Canadian Income Survey distinguishes between income from market sources and government transfers. In 2015, 67 per cent of the aggregate income of Nova Scotians was from employment income, the lowest in Canada.
Nova Scotia and BC had the highest share of income from investment and retirement earnings at 15 per cent. This was likely influenced in part by Nova Scotia’s older population. Nova Scotia (10%) along with PEI (10%), New Brunswick (11%) and Quebec (9%), also had the highest shares of income from Old Age Security (OAS) and Canada Pension Plan (CPP).
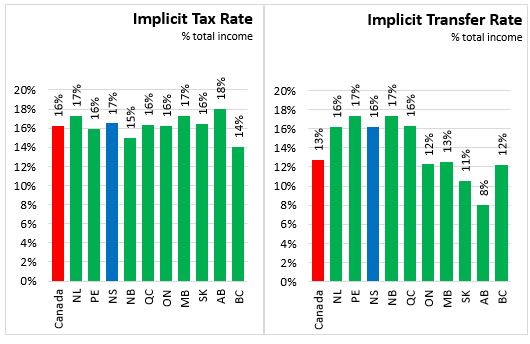
IMPLICIT TAX RATE
The income survey also assesses income taxes paid (federal and provincial) and after tax income.
In 2015, average income tax paid by economic families and persons not in an economic family decreased by 0.9 per cent in Nova Scotia compared to 2014 (constant 2015 dollars) while the average government transfers rose by 10.7 percent. In Canada, the average income tax paid decreased by 0.7 per cent while the average government transfer rose by 6.1 percent.
Information on taxes and transfers also allow for a calculation of an implicit 'transfer rate" (the share of total income generated by government transfers) and an implicit tax rate (the share of total income paid in income taxes). In 2015, Nova Scotia’s implicit tax rate (17%) for economic families and persons not in an economic family exceeded Nova Scotia’s implicit transfer rate (16%). This was the case for most provinces in 2015, with the exception of PEI, New Brunswick. and Quebec.
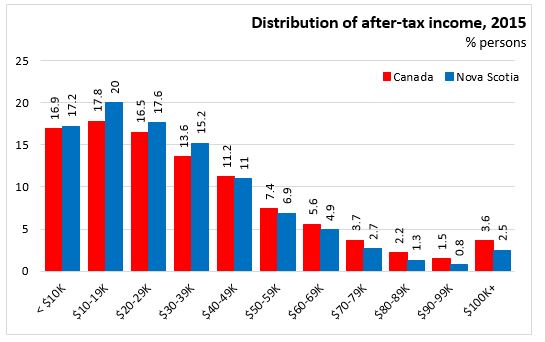
INCOME DISTRIBUTION
The survey also allows for comparison of income distribution. In Nova Scotia 2015, more than 50 per cent of persons in economic families and persons not in an economic families had income of $30,000 per year or less (after tax, including those with zero income) while only 2.5 per cent had incomes of $100,000 and above.
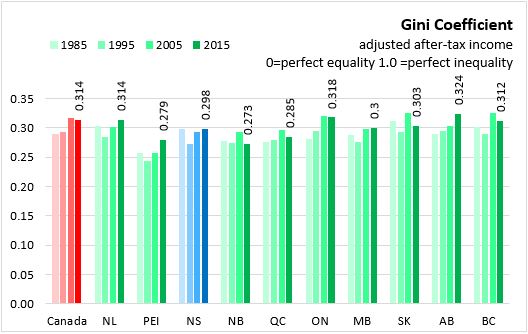
Another income distribution statistics available from the income survey is the Gini Coefficient which measures the relative degree of inequality in the distribution of income. The coefficient would register zero (minimum inequality) for a population in which each person received exactly the same adjusted household income and it would register a coefficient of one (maximum inequality) if one person received all the adjusted household income and the rest received none. Even though a single Gini coefficient value has no simple interpretation, comparisons of the level over time or between populations are very straightforward: the higher the coefficient, the higher the inequality of the distribution.
In 2015, Nova Scotia’s Gini coefficient was the fourth lowest in Canada at 0.298. This was up only slightly from ten years earlier when it was 0.293.
LOW INCOME
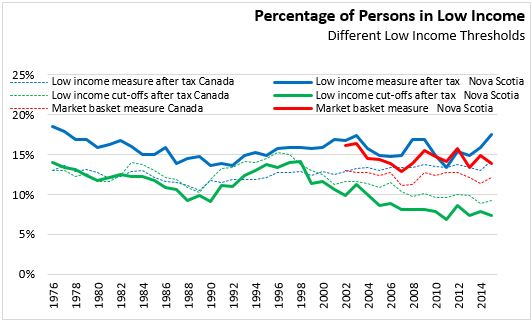
The income data reported by the Canadian Income Survey also allows for examination of those that are in 'low income'. There are a variety of definitions of low income, each corresponding to a threshold for household income below which all individuals would be considered in some form of low income. Each low income measure offers different insights into the nature of low income in Canada.
Low income measures (LIM) are more commonly used when making international comparisons. The threshold for LIM is 50 per cent of the median adjusted household income, where 'adjusted' indicates that household needs (based on size) are taken into account. The LIM is a relative measure - meaning that an equiproportional increase in income for all households would result in the same percentage identified as living in low income. In 2015, 17.5 per cent of Nova Scotians in economic families and persons not in an economic family were in low income under the LIM, measured after taxes. Across Canada, 14.2 per cent of persons were below the LIM-AT thresholds.
The Low Income Cut Off (LICO) measures families whose income would require them to devote a larger share of income on necessities of food, shelter and clothing than the average family. The LICO thresholds are adjusted based on the size of community, but are not specific to individual provinces. In 2015, 7.3 per cent of Nova Scotians were below the LICO, measured on an after-tax basis. Across Canada, 9.2 per cent of persons were below the LICO-AT threshold.
The Market Basket Measure (MBM) establishes a the cost of a basket of goods and services and identifies the share of the population whose income is insufficient to cover the cost of the basket. The thresholds for MBM are specific for community size and province. For 2015, the MBM shows that for Halifax, the total threshold is $37,778, whereas for rural Nova Scotia, the threshold is $39,249. Incidence of low income as measured by MBM are only available from 2002-2015. In 2015, 13.8 per cent of Nova Scotians in were in households below the MBM threshold. Across Canada, 12.1 per cent of persons fell below the MBM threshold.
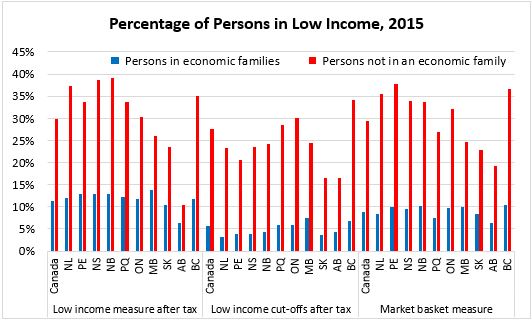
Incidence of low income varies with family type. An economic family is defined as a group of two or more persons who live in the same dwelling and are related to each other by blood, marriage, common-law, adoption or a foster relationship. By any measure and in any province of Canada, the percentage of persons in low income is higher for those who are not in an economic family than it is for those not in an economic family.
The Canadian Income Survey estimates are based on probability samples and are therefore subject to sampling variability. As a result, estimates will show more variability than trends observed over longer time periods.
Sources: Statistics Canada, Canadian Income Survey, CANSIM 206-0011 through 206-0094
|