For additional information relating to Daily Stats or any of our products, please contact:
View the Archive..April 22, 2024NEW HOUSING PRICE INDEX, MARCH 2024 Monthly (March 2024 vs February 2024)
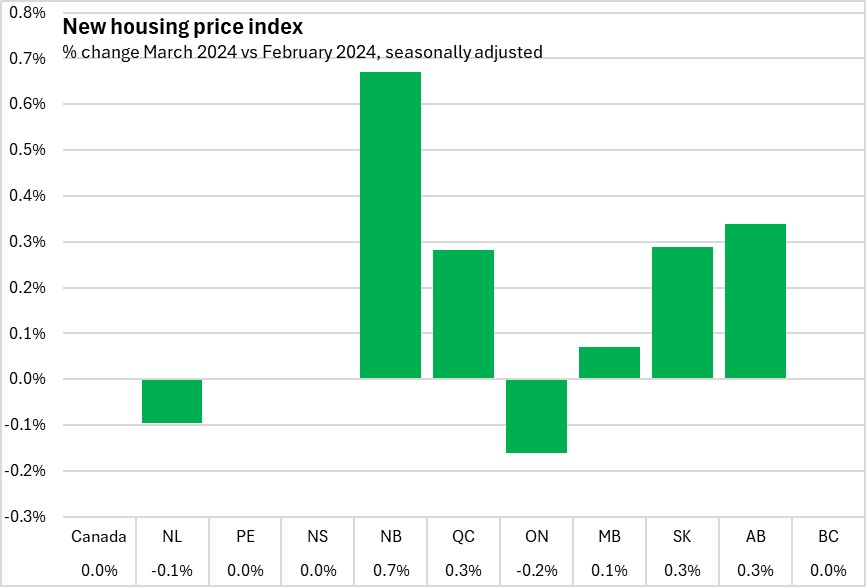
In Nova Scotia and nationally, new housing prices were unchanged in March over the previous month. Five provinces reported growth in new housing prices, three reported no changes and only Newfoundland and Labrador and Ontario reported monthly declines. ...
View complete article..
April 19, 2024BUILDING CONSTRUCTION, FEBRUARY 2024 Monthly (February 2024 vs January 2024, seasonally adjusted)
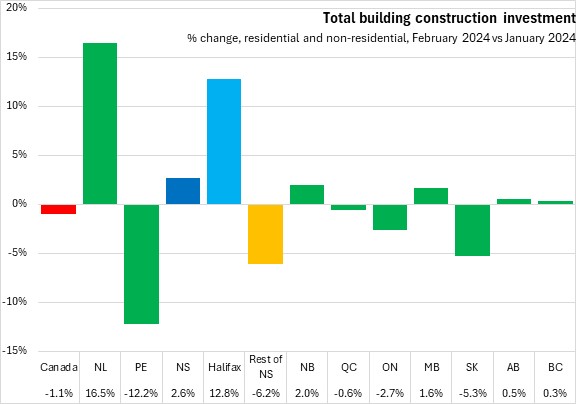
Investment in Nova Scotia building construction increased 2.6% in February 2024 to $515.5 million. Halifax monthly building construction rose 12.8% to $262.5 million and outside of Halifax building construction was down 6.2% to $253.0 million. Nationally, investment in building construct...
View complete article..
April 19, 2024HALIFAX BUSINESS CONDITIONS: APRIL 8-14, 2024 Statistics Canada has released real-time local business conditions from April 8 to 14, 2024. Reference dates reported now refer to the date following the end of the reference week. These data are not adjusted for seasonality and monthly or weekly changes may simply reflect regular seasonal patterns.
From August 10 of 2020 to April 15, 2024, the local business conditions index for Halifax has increased by 225.5%. In percentage terms, St. John's reported the strongest growth ...
View complete article..
April 19, 2024JAPAN CPI INFLATION, MARCH 2024 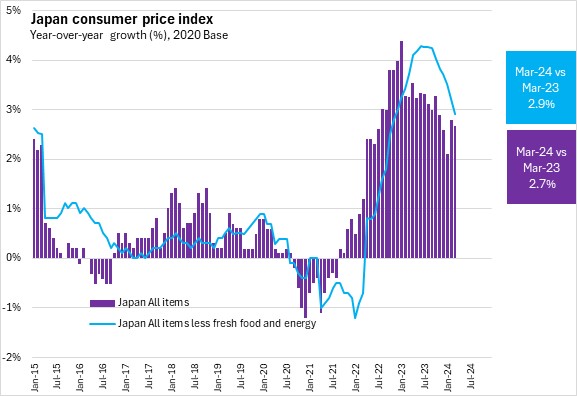
Japan’s inflation (all items, year-over-year growth in consumer price index) increased by 2.7% in March 2024. Japan's underlying inflation (all items excluding fresh food and energy) increased to 2.9%.
Japan's energy prices were down 0.6% in March 2024 compared with March 2023. Japan's food inflation increased 4.8% over this period. ...
View complete article..
April 18, 2024EMPLOYMENT INSURANCE, FEBRUARY 2024 Monthly (February 2024 vs January 2024, seasonally adjusted regular beneficiaries)
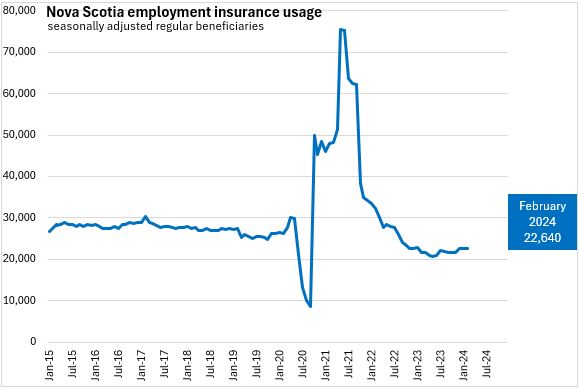
In February 2024, there were 22,640 Nova Scotians in receipt of regular employment insurance benefits (seasonally adjusted). Nova Scotia's seasonally adjusted regular employment insurance usage increased by 60 (+0.3%) from January to February 2024.
There wer ...
View complete article..
Top