The Economics and Statistics Division maintains archives of previous publications for accountability purposes, but makes no updates to keep these documents current with the latest data revisions from Statistics Canada. As a result, information in older documents may not be accurate. Please exercise caution when referring to older documents. For the latest information and historical data, please contact the individual listed to the right.
<--- Return to Archive
For additional information relating to this article, please contact:
September 19, 20122011 CENSUS OF POPULATION: FAMILIES, HOUSEHOLDS, MARITAL STATUS, STRUCTURAL TYPE OF DWELLING, COLLECTIVES Families and living arrangements of Canadians underwent further change and diversification during the past five years, according to data from the 2011 Census of Population. Census data show that married couples declined as a proportion of all census families between 2006 and 2011. Nevertheless, they still formed the predominant family structure in Canada, accounting for two-thirds of all families. In Nova Scotia, census families grew more slowly (+1.0%), than the national average (5.5%), owing to slower population growth and faster population aging

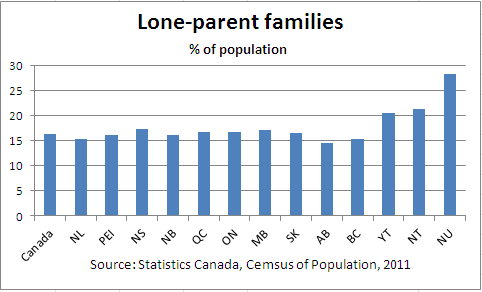
The proportion of common-law couples and lone-parent families both increased. For the first time, common-law couples outnumbered lone-parent families in 2011. In Nova Scotia, the proportion of lone-parent families was 17.3%, compared with the national average (16.3%).
Over the 10-year period from 2001 to 2011, couples with children living at home fell as a share of all census families. In 2001, there were more couples with children (43.6% of all census families) than couples without children (40.3%). In 2006, for the first time, there were slightly more couples without children than couples with children (42.7% and 41.4% of all census families, respectively). In 2011, this pattern was sustained, with the gap between couples with children (39.2% of census families) and couples without children (44.5%) growing larger. The following map shows couple families with children living at home as a percentage of all couple families by county in Nova Scotia.
Click the image to display a larger version.
The number of same-sex married couples nearly tripled between 2006 and 2011, reflecting the first full five-year period for which same-sex marriage has been legal across the country. Overall, same-sex couples accounted for 0.8% of all couples in Canada in 2011. The distribution of same-sex couples by province or territory was similar to opposite-sex couples.
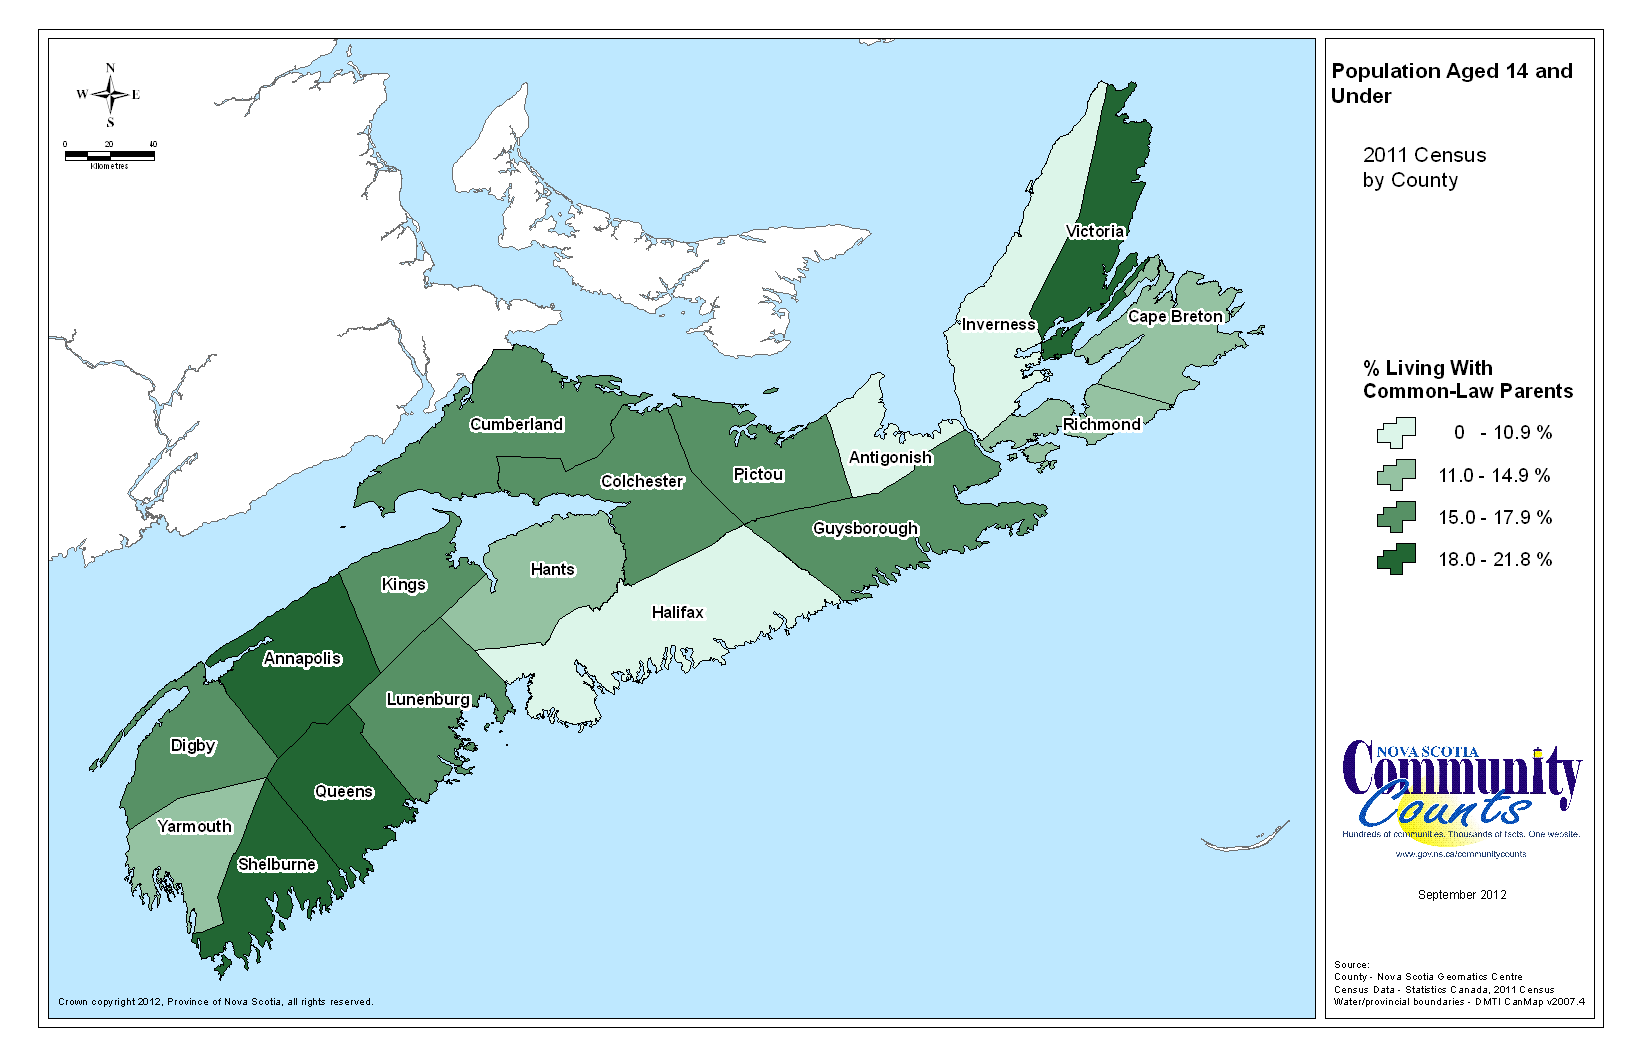
The proportion of children aged 14 and under who lived with common-law parents increased from 12.8% in 2001 to 16.3% in 2011. The following map shows the percentage of children age 14 and under who lived with common-law parents by county in Nova Scotia.

Click the image to display a larger version.
The 2011 Census of Population showed that 42.3% of the 4,318,400 young adults aged 20 to 29 lived in the parental home,1 either because they never left it or because they returned home after living elsewhere. The following map shows the percentage of young adults aged 20-29 who lived with their parents in 2011 by county in Nova Scotia.
Click the image to display a larger version.
A higher share of seniors aged 65 and over lived as part of a couple in a private household in 2011 compared with 2001. During the same period, the proportion of senior women who lived alone declined, while it remained relatively stable for senior men. About 1 in every 12 seniors lived in a collective dwelling, such as a nursing home or a residence for senior citizens.
<--- Return to Archive