The Economics and Statistics Division maintains archives of previous publications for accountability purposes, but makes no updates to keep these documents current with the latest data revisions from Statistics Canada. As a result, information in older documents may not be accurate. Please exercise caution when referring to older documents. For the latest information and historical data, please contact the individual listed to the right.
<--- Return to Archive
For additional information relating to this article, please contact:
April 17, 2024HOUSEHOLD INCOME AND CONSUMPTION, Q4 2023 Household Income and Outlay
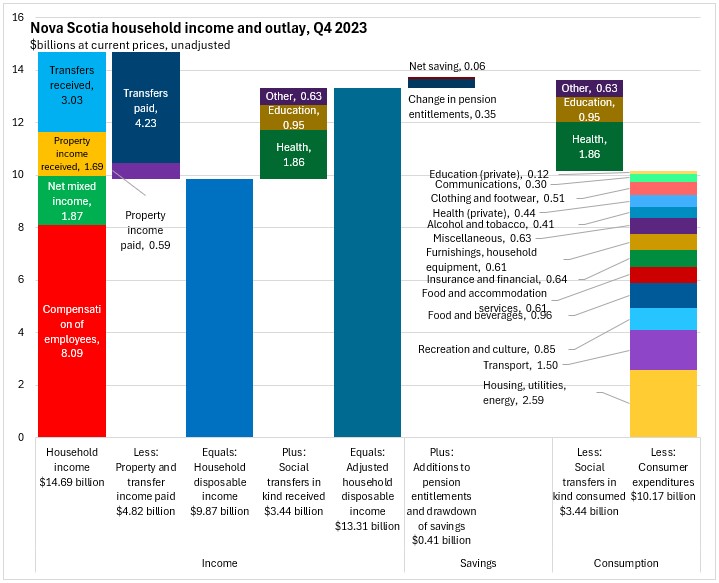
In addition to compensation of employees, household income also includes net mixed income (generated from unincorporated businesses), property income received (generated as the result of ownership of assets) and current transfers received (generally from government).
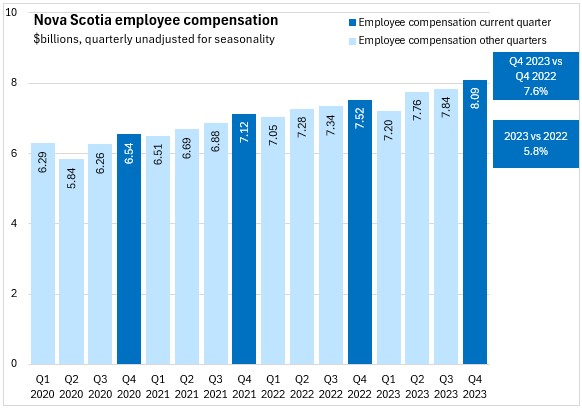
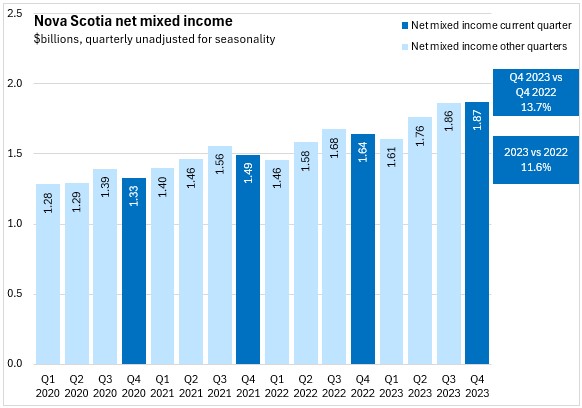
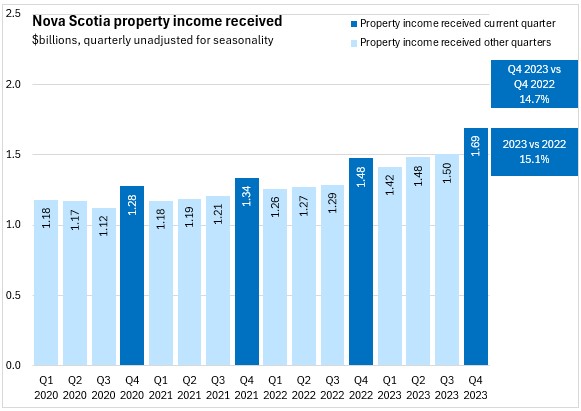
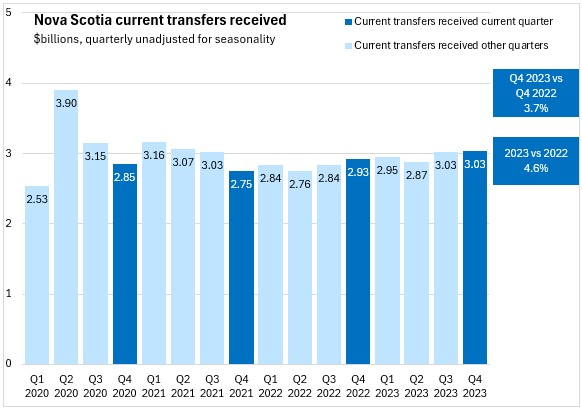
Nova Scotians received $14.69 billion in household income in Q4 2023, including $8.09 billion in employee compensation, $1.87 billion in net mixed income, $1.69 billion in property income received and $3.03 in current transfers received.
After paying current transfers (including income taxes) and property income, Nova Scotia disposable income was $9.87 billion in Q4 2023. Including the $3.44 billion value of social transfers in kind received from governments or non-profits in the form of services provided for households, Nova Scotia had adjusted disposable income of $13.31 billion.
The consumption of social transfers in kind matches the value of social transfers received ($3.44 billion), while households spent $10.17 billion on consumer expenditures. The value of household final consumption expenditures and social transfers in kind exceeded adjusted household disposable income, so the difference must be made up out of negative savings, including a reduction of $0.06 billion in household savings and a further $0.35 billion change in pension entitlements.
Household income
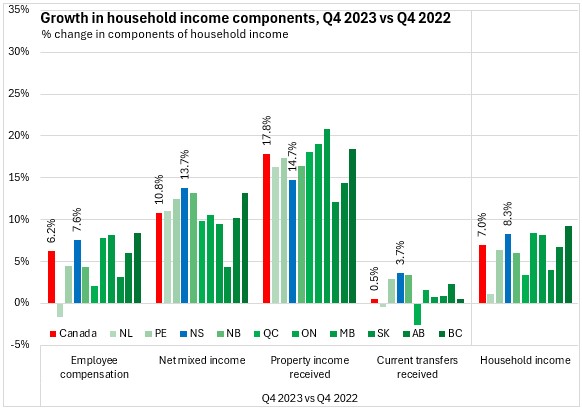
Nova Scotia's overall household income growth from Q4 2022 to Q4 2023 was 8.3% - above the national average growth rate of 7.0%. Household income growth was fastest in British Columbia, Ontario, and Nova Scotia. Newfoundland and Labrador reported a slowest growth in household income.
Nova Scotia's rising household income reflected employee compensation growth of 7.6%, which was above national average of 6.2%. British Columbia reported the fastest growth in employee compensation while Newfoundland and Labrador reported the only decline.
Nova Scotia's net mixed income from unincorporated businesses grew 13.7% from Q4 2022 to Q4 2023, the fastest growth among provinces. National net mixed income was up 10.8%. Saskatchewan reported the slowest growth from Q4 2022 to Q4 2023.
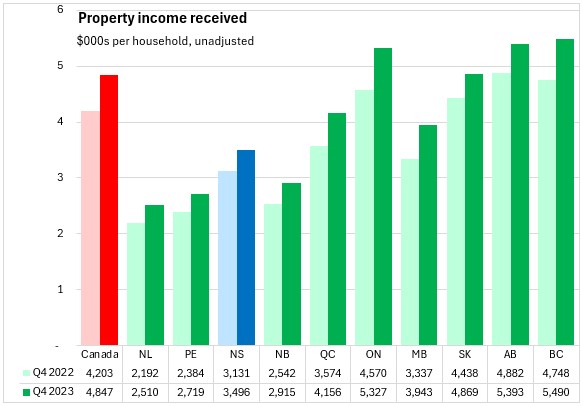
Despite a strong gain of 14.7% from Q4 2022 to Q4 2023, Nova Scotia's growth in property income receipts lagged all other provinces except Saskatchewan and Alberta. The national average gain in property income received was 17.8% with the fastest growth in Manitoba.
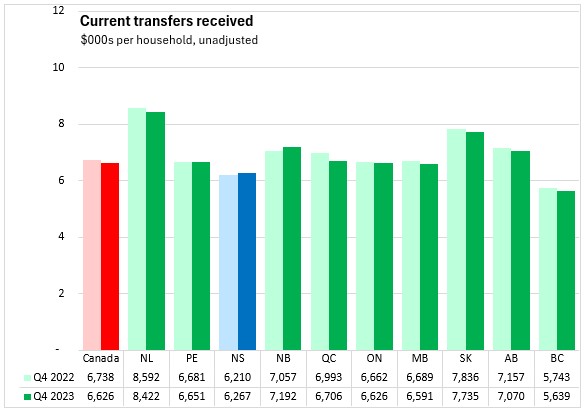
Current transfers received were up 3.7% in Nova Scotia from Q4 2022 to Q4 2023, above the national pace of 0.5%. Nova Scotia and New Brunswick reported the fastest growth in transfers while Québec and Newfoundland and Labrador reported declines.
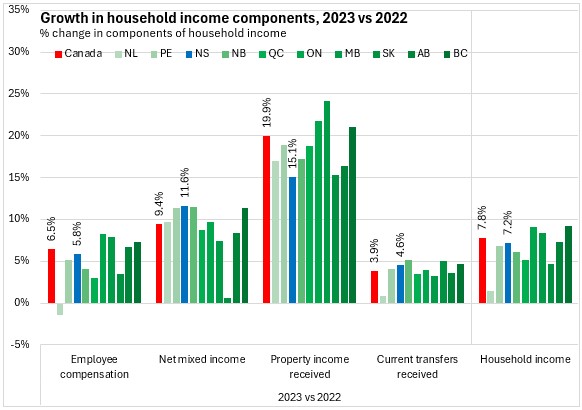
Compared with 2022, Nova Scotia's household income was up 7.2% - slower than the national pace of 7.8%. British Columbia and Ontario reported the fastest gains in household income while Newfoundland and Labrador reported the slowest.
Nova Scotia's employee compensation was up 5.8% in 2023, short of the national gain of 6.5%. Ontario and Manitoba reported the fastest growth in employee compensation while Newfoundland and Labrador was the only province to report declining employee compensation.
Nova Scotia's net mixed income was up 11.6% in 2023, a stronger gain than the national pace of 9.4% (fastest growth: Nova Scotia, slowest growth: Saskatchewan).
Nova Scotia's property income receipts increased by 15.1% - the slowest among provinces. The national pace of property income growth was 19.9% in 2023, led by Manitoba and Ontario.
Current transfers were up 4.6% in Nova Scotia, a stronger gain than the national pace of 3.9%. Saskatchewan and New Brunswick reported the fastest growth in current transfers received while Newfoundland and Labrador reported the slowest rise.

In Q4 2023, Nova Scotia's household income was $30,353 per household or 79.5% of the national average ($38,200). The highest income per household was in Alberta and lowest in Prince Edward Island.

Nova Scotia's employee compensation $16,726 per household, amounting to 74.1% of the national average per household ($22,582). Alberta reported the highest employee compensation per household and Prince Edward Island the lowest.

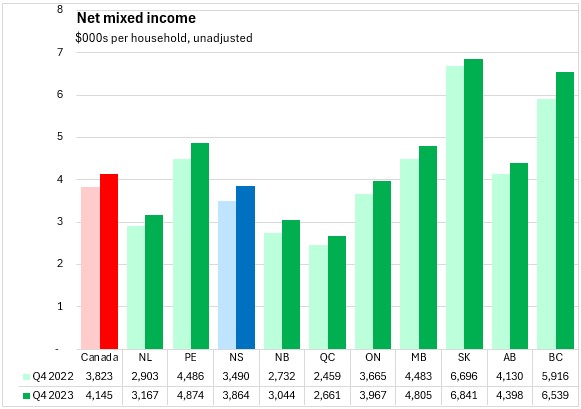
Net mixed income generated by unincorporated businesses amounted to $3,864 per household, which was 93.2% of the national average per household of $4,145. Across Canada, the highest value of net mixed income per household was in Saskatchewan and the lowest was in Québec.
Nova Scotia property income received in Q4 2023 was $3,496 per household, which was 72.1% of the national average ($4,847 per household). The highest property income values were in British Columbia, Alberta, and Ontario. The lowest property income per household was in Newfoundland and Labrador.
Current transfers received in Nova Scotia were $6,267 per household in Q4 2023. Current transfers received in Nova Scotia were 94.6% of the national average per household ($6,626). Transfers per household were highest in Newfoundland and Labrador and lowest in British Columbia.
Household Consumer Expenditures
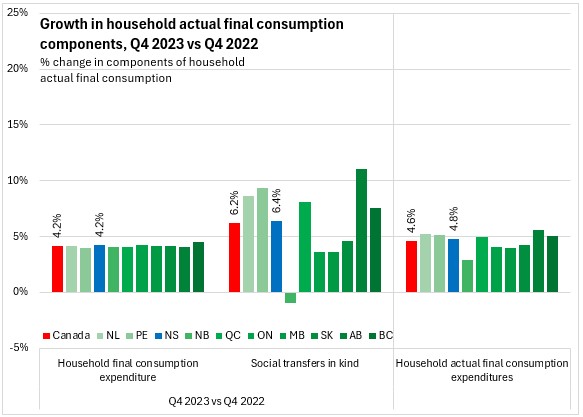
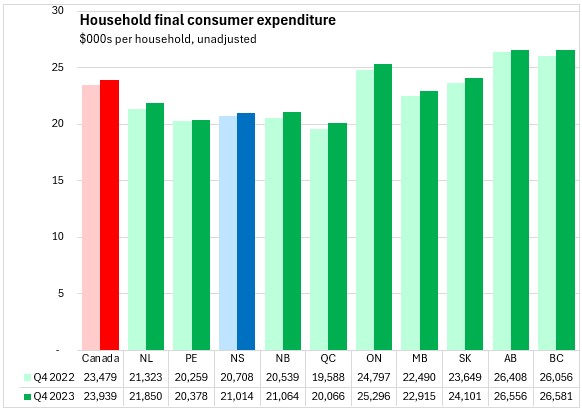
Comparing Q4 2023 with Q4 2022, Nova Scotia's household consumer expenditures increased by 4.2%, same as national pace of 4.2%. British Columbia reported the fastest growth rate in household consumer expenditures. All provinces reported similar growth rates, ranges from 4.0% to 4.5%.
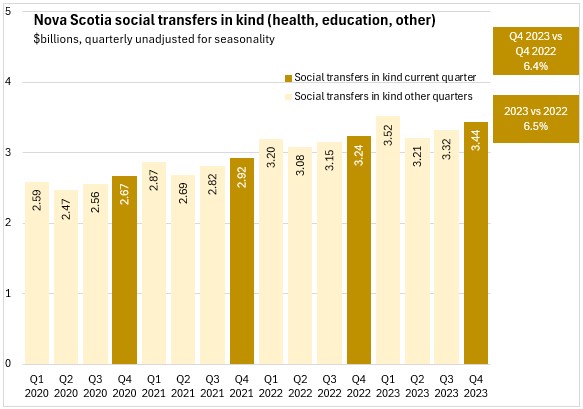
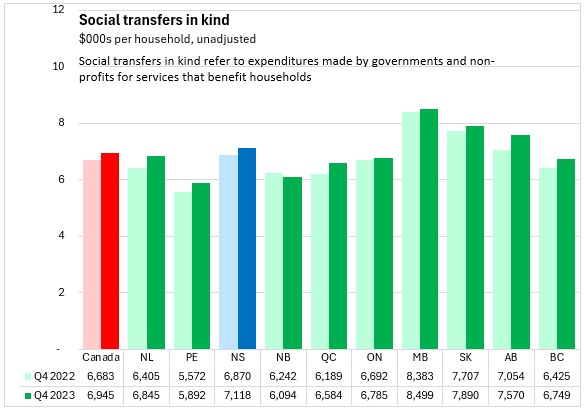
Social transfers in kind refer to services that are provided for the benefit of households but are paid for by governments and non-profits. These are primarily health and education expenditures, which add to private expenditures made on these services. Social transfers in kind increased by 6.4% in Nova Scotia (6.2% nationally) from Q4 2022 to Q4 2023. Social transfers in kind grew fastest in Alberta while New Brunswick reported the only decline.
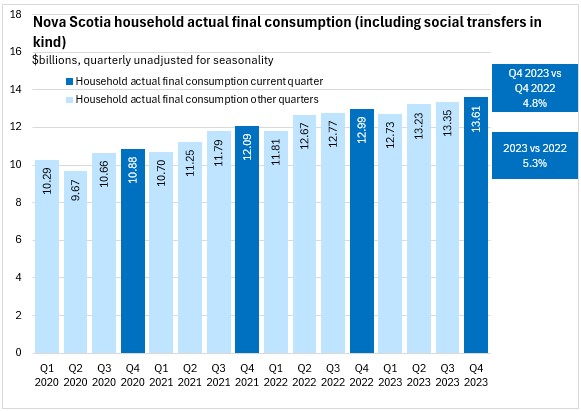
The sum of household final consumer expenditures and social transfers in kind is termed 'household actual final consumption expenditures', which reflects the benefits to households from both private expenditures as well as services provided by governments and non-profits. Combining these two components led to household actual final consumption growth of 4.8%, which was stronger than the national growth of 4.6%. Alberta reported the fastest growth in actual final consumption while New Brunswick reported the slowest growth.
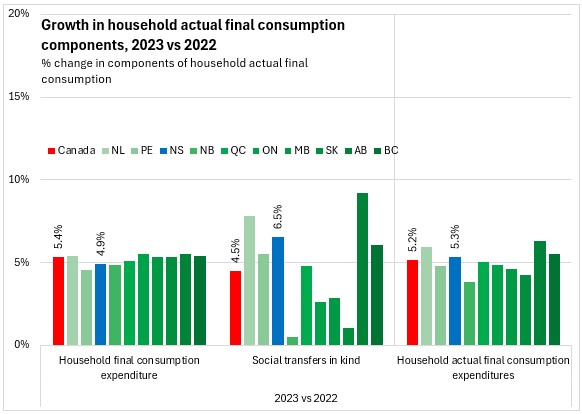
Compared with 2022, Nova Scotia's household final consumption expenditures were up 4.9% - slower than the national pace of 5.4%. Ontario and Alberta reported the fastest growth rates in household consumption expenditures while Prince Edward Island reported the slowest growth.
In 2023, Social transfers in kind were up 6.5% in Nova Scotia - the third fastest growth after Alberta and Newfoundland and Labrador. National social transfers in kind grew by 4.5% with the slowest rises in New Brunswick and Saskatchewan.
Household actual final consumption (household consumption expenditures plus social transfers in kind) was up 5.3% in Nova Scotia in 2023. Canada's household actual final consumption expenditures grew 5.2% with the fastest growth rates in Newfoundland and Labrador and Alberta. New Brunswick reported the slowest rise in actual final consumption.

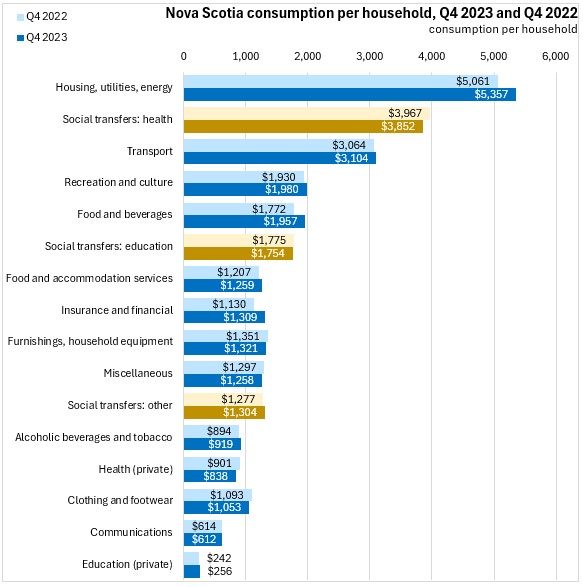
Among the categories of actual final consumption expenditures, housing/utilities/energy made up the largest category of household consumer expenditures, followed by social transfers in kind for health care, transportation, recreation/culture and food/beverages.
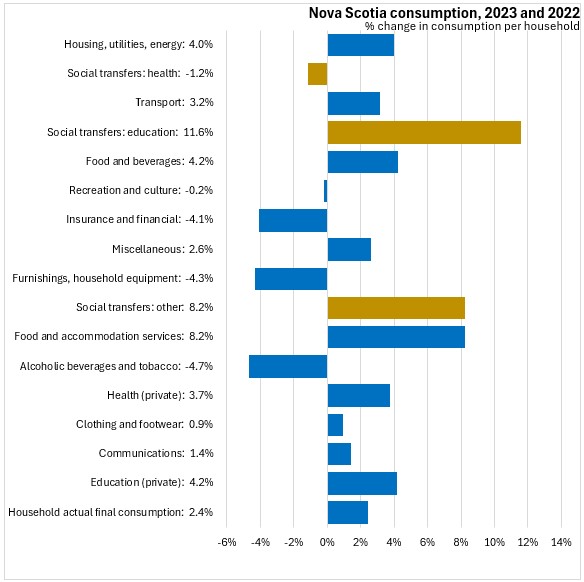
From Q4 2022 to Q4 2023, growth in per household spending was fastest in social transfers for non-health purposes (other and education), followed by housing/utilities/energy. Expenditures were down for health social transfers, recreation/culture, insurance/financial services, household furnishings/equipment, alcohol/tobacco, clothing/footwear and communications.
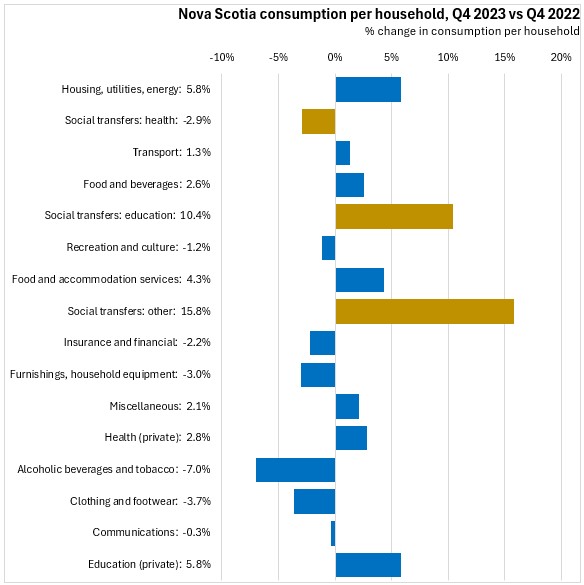
In 2023, actual final consumption expenditures per household were up most (in percentage terms) for education social transfers, other social transfers, and food/beverage services. Household expenditures were down for alcohol/tobacco, insurance/financial services, furnishings/household equipment, health social transfers, and recreation/culture.
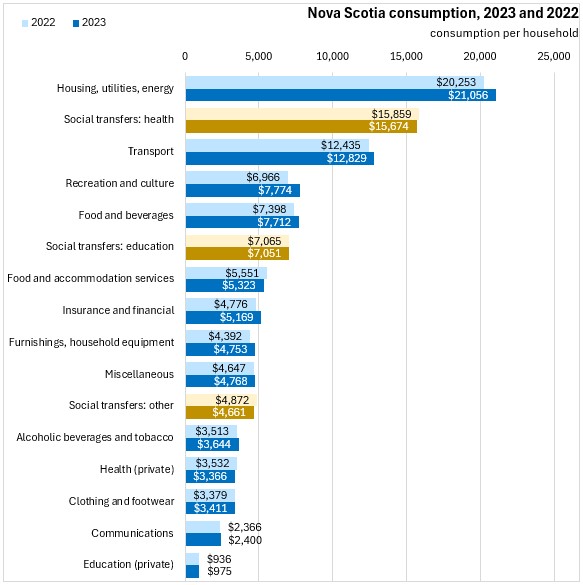
Nova Scotia's final consumer expenditures (paid for private by households) amounted $21,014 per household (87.8% of the national average per household). Across Canada, final consumer expenditures per household were $23,939 with the highest values in British Columbia and Alberta and the lowest in Québec.
In Q4 2023, Nova Scotian households received $7,118 per household worth of social transfers in kind (102.5% of the national average per household). Across Canada, social transfers in kind were $6,945 per household with the highest value in Manitoba and the lowest value in Prince Edward Island.
Nova Scotia's household actual final consumption expenditures in Q4 2023 were $28,132 per household (91.1% of the national average per household). National household actual final consumption expenditures were $30,884 per household with the highest value in Alberta and the lowest value in Prince Edward Island.

In Q4 2023, Nova Scotia's net savings per household were a positive $116. Only Newfoundland and Labrador reported negative net savings in Q4 2023. National savings were a positive $2,193 per household with the highest values in Saskatchewan and Alberta.

Source: Statistics Canada. Table 36-10-0663-01 Distributions of household economic accounts, income, consumption and saving, Canada, provinces and territories, quarterly (x 1,000,000)
<--- Return to Archive